Construct and visualize the graph#
After completing Add Nodes and Add Edges, you can continue to complete the generation of the graph engine.
Designated Entry Node#
First, call the set_entry_point() method to specify the unique entry point in the graph. The entry point is the starting node at runtime and must have been added using add_node().
builder = GraphBuilder(state_schema=MyStateSchema)
builder.add_node("start_node", MyNode(), action_mode="any")
builder.set_entry_point("start_node")
Note
The entry node can have predecessor nodes. However, at runtime, it runs backward from the entry node, unable to trigger predecessor nodes.
Construct Graph Instance#
Build the graph instance using the build() method. Upon completion, you can obtain a GraphEngine in run mode or a GraphEngineDebugger in debug mode.
graph = builder.build(
    auto_conn_end=True,
    max_turn=100,
    timeout=60,
    graph_mode="run",
)
Main Parameters Description:
auto_conn_end: bool, whether to automatically connect all nodes without successors to the built-inENDnode, defaultTrue.max_turn: int, maximum number of rounds for the graph, used to prevent infinite loops.timeout: int, the timeout for a single node’s execution (seconds).graph_mode: str, the graph’s running mode,runindicates execution mode,debugindicates debug mode.db_file_path: str, persistent database file path, used to store state snapshots in debug mode.db_name: str, database name.
Graph Structure Visualization#
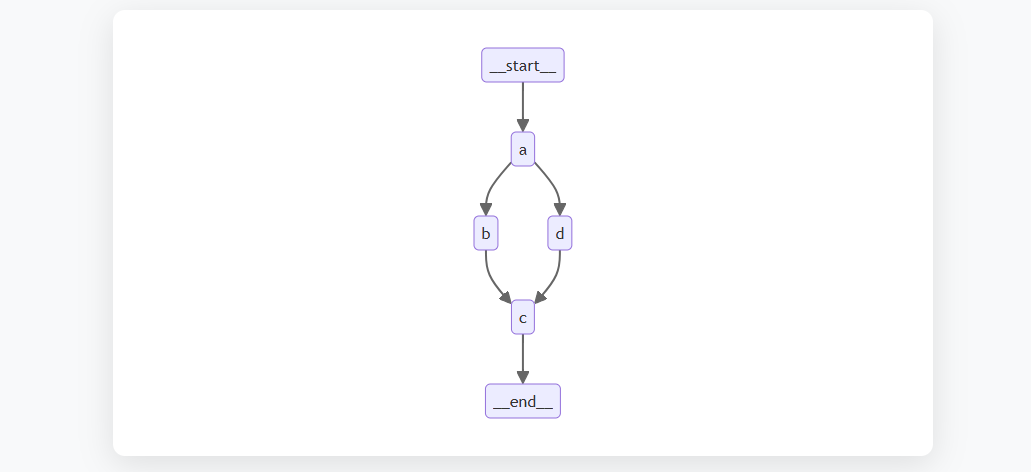
EvoFabric supports visualizing the graph structure after the build is completed, facilitating debugging and understanding the execution relationships between nodes. You can use the draw_graph() method to generate a visual representation of the graph.
from typing import Annotated, List

from pydantic import BaseModel

from evofabric.core.graph import GraphBuilder
from evofabric.core.typing import AssistantMessage


class State(BaseModel):
    messages: Annotated[List, "append_messages"]
    node_output: Annotated[str, "overwrite"]


def node_a(state):
    return {"messages": [AssistantMessage(content="node a output")], 'node_output': 'a'}


def node_b(state):
    return {"messages": [AssistantMessage(content="node b output")], 'node_output': 'b'}


def node_c(state):
    return {"messages": [AssistantMessage(content="node c output")], 'node_output': 'c'}


def node_d(state):
    return {"messages": [AssistantMessage(content="node d output")], 'node_output': 'd'}


graph = GraphBuilder(state_schema=State)
graph.add_node("a", node_a)
graph.add_node("b", node_b)
graph.add_node("c", node_c)
graph.add_node("d", node_d)

graph.add_edge("a", "b")
graph.add_edge("b", "c")
graph.add_edge("a", "d")
graph.add_edge("d", "c")
graph.set_entry_point("a")
graph = graph.build()

graph.draw_graph()
Drawing result: